
We’re less than two months from the US presidential election.
The race is close, basically a coin flip.
Polymarket (the world’s largest prediction market) pegs Kamala Harris’s odds at 52% and Donald Trump’s at 48%.
A lot can, and probably will, happen before November that’ll shake up markets.
|
In any case, the TV talking heads will be covering this from every angle. We’ll let them do their thing.
Here at RiskHedge, our job is to cut through the noise to help you make money.
To that end, I encourage you to check out One Chart to Rule Them All.
It’s a proprietary tool created by my RiskHedge colleague and prolific trader Justin Spittler. This is the first time he’ll share it publicly, although he’s used it for years to trade profitably.
In short, Justin looks at over 1 thousand stock charts… and then boils it all down into ONE simple chart to indicate where markets are headed.
Sign up here to get access—it’s free.
- Look at this ugly box...
The chart below is from Ryan Detrick at Carson Group. It shows the S&P 500’s average daily performance going back to 1950.
As you can see, we just kicked off what’s historically been the worst two-week stretch of the year for stocks:
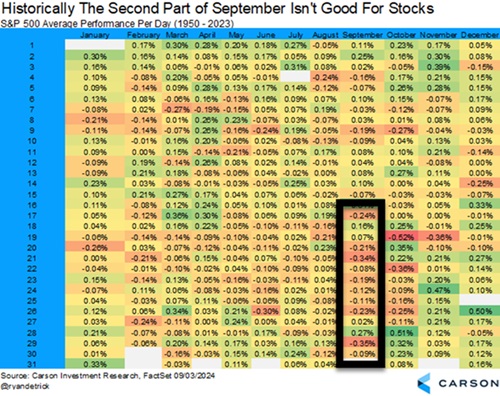
Source: Carson Group
If you’ve been following along, you know I’ve been warning about a rocky September. So far it’s been okay… but the real test comes now.
My script—and game plan—hasn’t changed.
I expect stocks to be volatile up until the election, followed by a rally after the die is cast.
What to do:
If you have stocks in your portfolio you’re not 100% confident in, now’s a great time to cut some fat.
- “Buy Nvidia (NVDA) at $272?? The price is currently $199; I’m confused.”
Thanks to everyone who wrote in regarding Friday’s Jolt: the six-year anniversary of when I recommended Nvidia for the first time. In that 2018 article, I laid out why NVDA was my pick “if I could only own one stock for the next five years.”
At the end of that essay, I wrote “I see NVDA doubling over the next two years. I’m buying it today at $272.”
Of course today, NVDA is around $120/share, as one RiskHedge reader correctly pointed out.
But readers who bought back in 2018 and held on are up 1,500% split-adjusted:
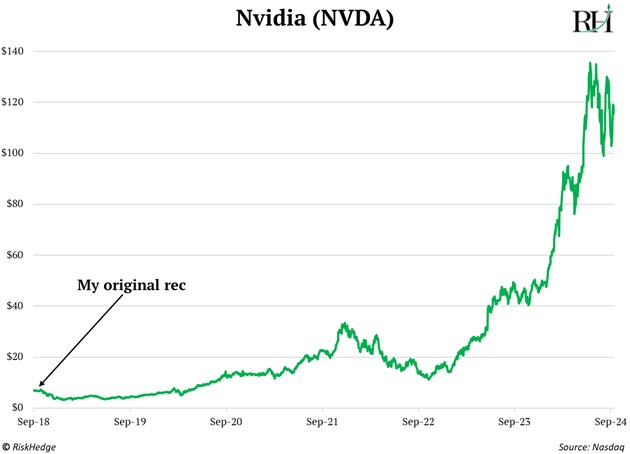
That’s because Nvidia has had two stock splits since 2018 ... a 4-for-1 split in July 2021 and a 10-for-1 split in May of this year.
Stock splits are the financial equivalent of exchanging a $10 bill for 10 $1 bills. It doesn’t make the stock any cheaper.
But many investors prefer stocks that trade for a lower dollar amount. Nvidia at $120/share looks a lot cheaper than Nvidia at $1,200/share.
In any case, using today’s split-adjusted prices, NVDA was roughly a $6 stock when I first recommended it.
- Today’s dose of optimism...
“Are you busy today, Dad?”
I knew exactly why my five-year-old daughter asked me this while walking to school the other day.
She had a dance performance, and she wanted me there.
Striking a balance between family and work is hard. Look at Larry Miller. He was the richest man in Utah, a billionaire.
But he died unhappy, full of regret, as he recounts in his autobiography:
I missed the first day of kindergarten and playing catch in the yard. I missed dinner at home with my wife and kids… I missed all those years with my family, and I can't have them back… All you've got to do is be there.
Those words give me goosebumps. I went to Aubrey’s dance. Glad I did.
Stephen McBride
Chief Analyst, RiskHedge
PS: Here’s the link to put your name on the list for my friend Justin Spittler’s One Chart to Rule Them All video showcase. He’ll share how you can use it to help predict where markets are headed every Monday—an extremely useful ability as we head further into a volatile election season. Sign up here.