
One of retail’s most “trusted” indicators is flashing danger.
This morning, the CNN Fear & Greed Index displayed a reading of 74. It’s now bordering on “Extreme Greed.”
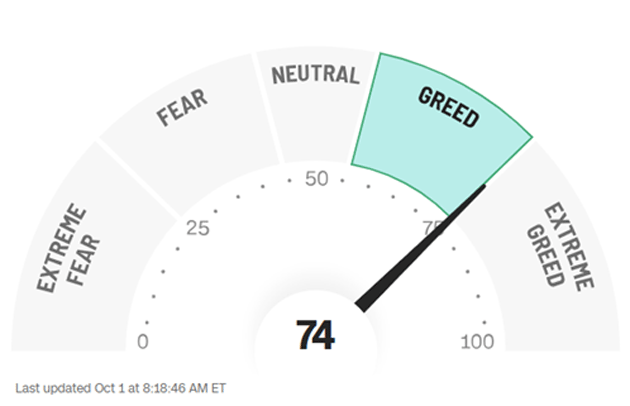 Source: CNN
Many consider this a major red flag. I know because I can’t go five minutes on Twitter without someone mentioning the Fear & Greed Index.
And I get why people are spooked…
The Fear & Greed Index is one of the easiest ways for traders to get a sense of market sentiment… at least in theory.
But this popular index is highly flawed.
The good news is that there’s a much better way to take the market’s pulse. My proprietary PRO Meter tells me what kind of market environment we’re in every week by comparing “risk-on” sectors with “risk-off” sectors.
I just got on camera to break down exactly how it works, using one simple chart. Check it out here.
Let me tell you why I couldn’t care less about the Fear & Greed Index.
This index considers seven indicators: momentum, stock price strength, breadth, put/call ratios, junk bond demand, market volatility, and safe-haven demand.
These are all relevant factors to consider as a trader. But the Fear & Greed Index interprets them incorrectly.
Let’s start with momentum, specifically where the S&P 500 is trading at versus its 125-day moving average.
It’s currently about 6.5% above that moving average. According to CNN, this constitutes “extreme greed.” But there’s nothing extreme about this.
Back in December 2023, the S&P 500 was trading more than 7% above its 125-day moving average. It didn’t crash from this level. Instead, it rallied almost 22% higher.
That’s because markets with strong upward momentum tend to keep climbing.
And that’s just one big issue with this index...
The Fear & Greed Index is also showing extreme greed readings in market breadth and “stock price strength,” which—in this case—compares net new highs on the New York Stock Exchange with net new lows.
Both of these factors indicate that market participation is improving, not getting worse. In other words, many stocks are working!
As someone who looks at thousands of charts, I can confirm this. I’m seeing more A+ setups than I’ve seen in months.
This is a sign of a healthy market… not something to fear.
The Fear & Greed Index is also showing “extreme greed” in how it measures safe-haven demand. In other words, stocks are outperforming bonds (i.e., safer assets) by a wide margin.
Last time I checked, this indicates that we’re in a “risk-on” environment. As traders, this is precisely when we should buy stocks.
In short, there are several major flaws with the CNN Fear & Greed Index. In fact, at certain times I would do the exact opposite of what it suggests.
The data supports my view that the Fear & Greed Index is of questionable use. Take a look at this chart from Sentiment Trader:
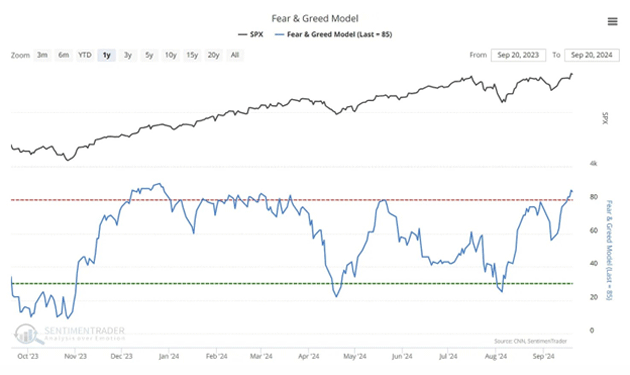 Source: Sentiment Trader
Notice recent extreme readings in the Fear & Greed Index haven’t exactly marked tops.
In fact, the hottest reading over the past 12 months came last December. The S&P 500 has been grinding higher ever since. In other words, you’d have done well buying stocks during the last “Extreme Greed” reading.
It wouldn’t surprise me at all if that’s happening right now.
That’s why I rely on my own PRO Meter indicator. It helps me cut through the noise and get my finger on the pulse of what’s really going on in the market… so I can get into the right industries at the right time.
If you didn’t catch it, yesterday I made an exciting announcement that can benefit you. I’ve created a new, simple way for you to get my three best stock recommendations every week. Go here for details.
Justin Spittler
Chief Trader, RiskHedge